Help & Guides
Quick instructions for downloading brokerage CSV files and importing them into KIFOLIO.
Charles Schwab CSV
Download your Positions CSV and import it into KIFOLIO.
Fidelity CSV
Download your Positions CSV and import stocks and supported options.
Import into KIFOLIO
Open Portfolio, select your account, and import the saved CSV.
Frequently Asked Questions
Privacy, prices, stock splits, dividends, and CSV support.
Charles Schwab CSV Downloads
KIFOLIO uses separate Schwab CSV exports for holdings and dividend income.
1. Holdings — Positions CSV
Use the Positions page to export your current holdings.
- Sign in to Charles Schwab.
- Go to Accounts → Positions.
- Click the Download icon in the upper-right corner.
- Save the CSV file.
- Use this file for your KIFOLIO portfolio holdings import.

2. Dividend Income — Investment Income CSV
Use the Investment Income page to export dividend and investment income information.
- Go to Accounts → Investment Income.
- Click the Download icon in the upper-right corner.
- Select the desired date range.
- Save the CSV file.
- Use this file for dividend income import when that feature is available in KIFOLIO.

Positions CSV = holdings
Investment Income CSV = dividend and investment income
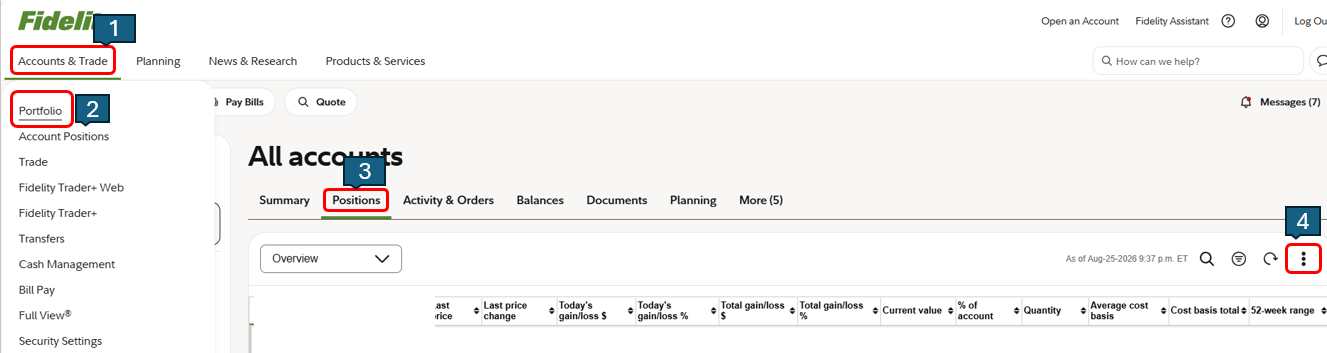
Fidelity — Download Positions CSV
Use the Portfolio → Positions page to export your current holdings.
- Sign in to Fidelity.
- Go to Accounts & Trade → Portfolio.
- Open the Positions tab.
- Open the More menu (three dots) on the right side.
- Select the download/export option and save the CSV file.
- Import the saved CSV into KIFOLIO.
Import CSV into KIFOLIO
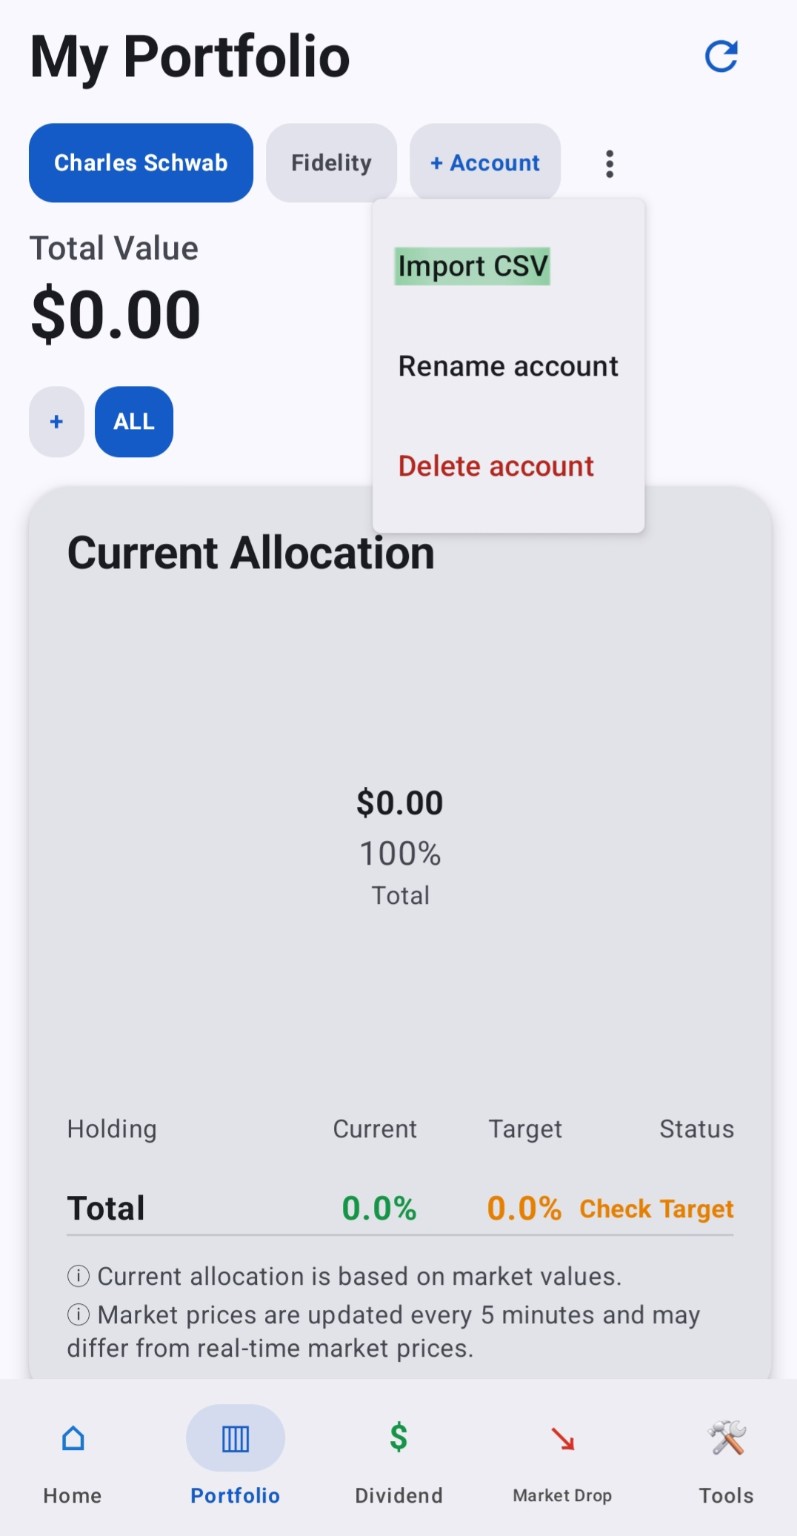
After downloading your supported brokerage CSV file, import it into the account you want to update in KIFOLIO.
- Open Portfolio.
- Select the account you want to import into.
- Tap the three-dot menu (⋮).
- Select Import CSV.
- Choose your supported Schwab or Fidelity CSV file.
- Review the imported information before confirming any changes.
Other Brokerages
KIFOLIO currently supports CSV import for Charles Schwab and Fidelity only. For Robinhood, Webull, and other brokerages, please enter holdings manually.
Frequently Asked Questions
Choose the part of KIFOLIO where you have a question.
Home
Why is my Portfolio Value different from my brokerage?
KIFOLIO may differ from your brokerage because of market-price update timing, cash included in the account, imported data, or other account differences. Your brokerage should be treated as the source of truth for your official account value.
What does “Today” mean?
“Today” shows the estimated change in your portfolio based on today’s market-price movement. It is different from Total Gain / Loss, which reflects the overall gain or loss on your holdings.
What is Total Gain / Loss?
Total Gain / Loss is the estimated overall gain or loss on your holdings based on the cost information stored in KIFOLIO and the latest available market prices.
Why is Portfolio Value History empty or incomplete?
KIFOLIO portfolio history begins when portfolio history is recorded in the app. It does not automatically recreate your brokerage account’s complete historical performance, so older history may be unavailable.
What does Market Status or Healthy Trend mean?
Market Status is an informational indicator based on SPY and QQQ relative to their 200-day moving averages. “Healthy Trend” does not mean that you should buy, sell, or hold an investment. It is not an investment recommendation.
What does “Above 200-Day MA” mean?
It shows approximately how far the current market price is above its 200-day moving average. Market data may be delayed or differ from other data sources.
What is the 52-Week High Drop Summary?
It shows how far a tracked market symbol is below its reference high. It is for informational purposes only and is not a signal or recommendation to buy or sell.
What does All Accounts show?
All Accounts combines supported portfolio information from your KIFOLIO accounts into one Home summary. Selecting an individual account shows information for that account only.
What are Scheduled Notes on the Home screen?
Scheduled Notes are Investment Notes that you chose to temporarily show on the Home screen. Only notes that are currently within their selected display period are shown.
Future scheduled notes do not appear before their start date, and expired notes automatically disappear from Home without being deleted.
Portfolio
Which brokerage CSV files are supported?
Charles Schwab and Fidelity are currently supported. Other brokerage CSV formats should be entered manually.
What is Target Allocation?
Target Allocation is the percentage of your portfolio that you plan to allocate to each holding. It is a personal target that you set in KIFOLIO and is not an investment recommendation.
What is Current Allocation?
Current Allocation is calculated from each holding's current market value compared with the total value of the selected portfolio.
What do Over and Below mean?
Over means the holding's current allocation is above your target. Below means it is below your target. For example, if a holding is 66.3% of your portfolio and your target is 50.0%, KIFOLIO shows Over 16.3%.
What is Allocation Excess?
Allocation Excess estimates how much of a holding's current value is above its target allocation based on the current portfolio value. It is informational only and is not a recommendation to sell.
Why must Target Allocation Total equal 100%?
Your stock and cash target percentages together represent your entire planned portfolio, so the Target Allocation Total must equal 100%.
Does KIFOLIO automatically rebalance my portfolio?
No. KIFOLIO only shows the difference between your current and target allocations. It does not buy, sell, or automatically rebalance investments.
Is Cash included in Target Allocation?
Yes. If you set a cash target, it is included with your stock targets when calculating the 100% Target Allocation Total.
How do I import a CSV file?
Open Portfolio, select the account you want to update, open the three-dot menu, and choose Import CSV. Use the Schwab and Fidelity guides above for brokerage-specific download steps.
Is my brokerage CSV uploaded to KIFOLIO?
No. Brokerage CSV files are read on your device for import and are not uploaded to KIFOLIO.
Why didn't some holdings or options import?
Some rows may not match a supported CSV format or supported security type. Review the import preview and compare the result with your brokerage before confirming changes.
What should I do if KIFOLIO data does not match my brokerage?
Your brokerage account should be treated as the source of truth. KIFOLIO is a portfolio tracking tool, and market, dividend, split, or imported data may occasionally be delayed, incomplete, or inaccurate. Verify important information with your brokerage before making changes or investment decisions.
Dividend
What is Estimated Dividend Income?
Estimated Dividend Income is an estimate based on your current shares and recent dividend information. Actual dividend payments may be different.
How is Monthly Average calculated?
Monthly Average is the estimated annual dividend income divided across 12 months. It does not mean that you will receive the same amount every month.
How is Annual Estimate calculated?
Annual Estimate is based on your current share quantity and recent dividend information available to KIFOLIO. It is an estimate and is not guaranteed.
What is Portfolio Yield?
Portfolio Yield compares estimated annual dividend income with the current value of the portfolio. It can change as market prices, holdings, or dividend information change.
What is the difference between Estimated Dividend and Received Dividend?
Estimated Dividend is a projection of possible future dividend income. Received Dividend records dividend payments that you actually received and entered or imported into KIFOLIO.
Why is Received YTD $0 even though Estimated Income shows a dividend?
Estimated Income is not an actual payment record. Received YTD can remain $0 until received dividend payments are entered manually or imported into KIFOLIO.
What does Quarterly or Monthly mean?
This is the estimated dividend frequency based on recent dividend history. It does not guarantee that future dividends will follow the same schedule.
What are Historical Ex Months?
Historical Ex Months show months in which recent ex-dividend dates occurred. For example, 3 / 6 / 9 / 12 indicates historical ex-dividend activity in March, June, September, and December. It is not a guarantee of future dividend dates.
Why can Dividend Yield differ from my brokerage?
Dividend Yield can differ because of market-price timing, recent dividend amounts, data updates, or calculation methodology. Verify important dividend information with your brokerage or the security issuer.
What does Add Dividend Received do?
Add Dividend Received lets you manually record a dividend payment that you actually received. The payment is added to your Received Dividend history.
What is the Monthly Dividend Goal?
Monthly Dividend Goal is a personal monthly dividend-income goal that you set in KIFOLIO. The goal section compares your estimated monthly dividend income with that target. It is a planning tool only and is not an investment recommendation.
What is Estimated Investment Needed?
Estimated Investment Needed is an estimate of the additional investment that may be required to reach your saved monthly dividend goal using the portfolio yield currently available to KIFOLIO. Actual results can change as prices, holdings, and dividends change.
What does the Dividend Calculator do?
The Dividend Calculator lets you enter a dividend-paying ticker and the number of shares you want to model. KIFOLIO uses available market price and dividend information to estimate Monthly Average dividend income, Annual Estimate, Estimated Cost, and Combined Yield.
Can I calculate dividends for more than one stock?
Yes. Use + Add Stock to add multiple dividend-paying tickers and share amounts. KIFOLIO combines the modeled positions to estimate total monthly and annual dividend income, estimated cost, and the combined dividend yield.
How does the Monthly Dividend Target in the calculator work?
Enter the monthly dividend income you want to model. KIFOLIO estimates the Total Investment Needed and Additional Investment based on the calculator's current modeled holdings and available dividend yields.
What does Shares Needed for Monthly Target mean?
It estimates the target share quantity and additional shares for each ticker needed to reach the selected monthly dividend target. When multiple stocks are used, KIFOLIO keeps the same simulated portfolio mix while scaling the share amounts.
Why can the Dividend Calculator result change?
The calculator uses available prices, dividend amounts, and dividend yields. These values can change or may be delayed, so the results are estimates for informational and planning purposes only.
Why does Dividend Goal show $0.00?
If no monthly dividend goal has been configured for the selected account, KIFOLIO may display a $0.00 goal. You can set a goal to compare it with your estimated monthly dividend income.
Why does KIFOLIO say “No upcoming dividend payments”?
KIFOLIO may not currently have a confirmed upcoming payment for your holdings, or dividend information may not yet be available. This does not guarantee that no dividend will be paid. Verify dividend information with your brokerage or the security issuer.
Why can dividend information change?
Dividend dates, amounts, yields, and payment information may be revised by issuers or data providers. Dividend data may also be delayed, incomplete, or unavailable.
Does KIFOLIO guarantee upcoming dividend dates or amounts?
No. Upcoming dividend dates and amounts are informational estimates only. Companies can change, postpone, reduce, or cancel dividends, and data may be delayed or incomplete.
What does Import Dividend CSV import?
Import Dividend CSV imports supported received-dividend records from a supported brokerage CSV file. It is separate from KIFOLIO's estimated dividend income calculations.
Market Drop
What is the Reference High?
Reference High is the high price KIFOLIO currently uses to calculate your selected Drop 1, Drop 2, and Drop 3 levels.
What is the difference between Reference High and Current 52-Week High?
Current 52-Week High reflects the latest available 52-week high data. Reference High is the value currently being used to calculate your saved Market Drop levels.
What do Drop 1, Drop 2, and Drop 3 mean?
They are percentage levels below the Reference High that you choose for tracking market declines. They are informational levels only and are not recommendations to buy or sell.
How are the Drop prices calculated?
Each Drop price is calculated from the Reference High and the percentage you selected. For example, an 8% drop level represents a price approximately 8% below the Reference High.
What does “1.7% from Reference High” mean?
It shows approximately how far the current price is below the Reference High. This percentage changes as the current market price changes.
Why can the 52-week high differ from another website or brokerage?
Values can differ because of data-source methodology, reference dates, market adjustments, or update timing. Verify important market information with your brokerage or another authoritative source.
Why can the Current Price be different from my brokerage?
KIFOLIO market prices are not real-time and may update at a different time from your brokerage, so prices can differ temporarily.
How often are Market Drop prices updated?
Market prices are updated periodically during supported U.S. extended market hours on trading days and are not real-time.
What is the 200-Day MA?
The 200-day moving average is a long-term price trend reference based on approximately the previous 200 trading days.
What do 7D, 1M, 3M, 6M, 1Y, 5Y, and ALL mean?
These buttons change the time period displayed in the Price History chart. They do not change your saved Drop levels.
What does the Quick Drop Calculator do?
The Quick Drop Calculator calculates the percentage and price difference between a starting price and a current price. It does not change your saved Market Drop settings.
Can I change my Drop percentages?
Yes. You can edit the Drop levels for a tracked symbol. KIFOLIO recalculates the corresponding Drop prices using the Reference High.
Is Market Drop a buy or sell signal?
No. Market Drop, Reference High, moving averages, and drop levels are informational tracking tools only and are not investment recommendations.
Why can Market Drop data be delayed or different?
KIFOLIO uses third-party market data that may be delayed, incomplete, or updated on a different schedule from your brokerage.
Tools
Watchlist
What is the Watchlist?
Watchlist lets you track stocks and ETFs you are interested in without adding them to your portfolio.
What does Dividend Yield mean?
Dividend Yield shows the available annual dividend yield relative to the current market price. Dividend information may change or be delayed.
What does 52W High mean?
52W High is the highest available market price for the security during approximately the previous 52 weeks.
What does Drop from High mean?
Drop from High shows approximately how far the latest price is below its current 52-week high.
Why can the Latest Price or 52W High differ from my brokerage?
KIFOLIO uses third-party market data that may be delayed or updated at a different time from your brokerage.
What do the up and down arrows do?
The arrows let you change the display order of symbols in your Watchlist.
My ETF Simulator
What is My ETF Simulator?
My ETF Simulator is a planning tool that lets you create a target ETF allocation for each account, review ETF information, and simulate how that allocation would have performed using available historical prices and dividends. It does not place trades or change your brokerage account.
Can I create a different ETF mix for each account?
Yes. Each account can have its own ETF mix and target allocation. This allows you to maintain different ETF strategies for different brokerage or investment accounts.
What does Target Allocation mean?
Target Allocation is the percentage you choose for each ETF in the selected account. It represents your planned allocation and does not automatically reflect your actual brokerage holdings.
Why must Target Allocation equal 100%?
The ETF percentages together represent the entire target mix, so the total allocation must equal 100%.
What is Estimated Dividend Yield?
Estimated Dividend Yield is an estimate based on the dividend yields currently available for the ETFs and their target weights in your mix. Dividend information may change or be delayed.
What is the Investment Simulator?
The Investment Simulator estimates how your selected ETF mix would have performed using available historical prices and dividend data. You can enter an initial investment, choose a recurring investment amount and frequency, and select a simulation period.
What is Initial $?
Initial $ is the amount invested at the beginning of the simulation. The amount is allocated among the ETFs according to your target allocation.
What is Recurring $?
Recurring $ is the amount added repeatedly during the simulation. Each recurring investment is allocated among the ETFs according to your target allocation.
What investment frequencies can I simulate?
You can simulate Daily, Weekly, Every 2 Weeks, or Monthly recurring investments. Daily investments use available trading days.
What do 1Y, 2Y, 3Y, 4Y, and 5Y mean in the simulator?
These options select the requested historical simulation period. The simulation uses available historical data up to the selected period. If one or more ETFs do not have enough history, KIFOLIO uses the common available history and displays a Limited History notice.
What happens if an ETF does not have enough history for the selected period?
The simulation starts from the earliest date for which all ETFs in the selected mix have usable historical data. KIFOLIO displays a Limited History notice when the requested period cannot be fully simulated.
Why can a 5-year simulation contain less than five years of data?
If one or more ETFs in the mix began trading later or do not have five full years of historical data available, the simulation is limited to the common history shared by all ETFs in the mix.
What does Total Invested mean?
Total Invested is the initial investment plus all recurring contributions made during the simulated period.
What does No Reinvestment mean?
No Reinvestment shows the estimated ending value when dividends are kept as cash instead of being used to purchase additional ETF shares.
What does Dividend Reinvested mean?
Dividend Reinvested shows the estimated ending portfolio value when eligible dividends are used to purchase additional shares during the historical simulation.
What is Reinvestment Benefit?
Reinvestment Benefit is the estimated difference between the Dividend Reinvested result and the No Reinvestment result. It illustrates the historical effect of reinvesting dividends during the simulated period.
How are dividends reinvested in the simulation?
KIFOLIO estimates dividend reinvestment using available historical dividend information and the cached closing price on the ex-dividend date or the next available trading day. Actual brokerage reinvestment prices may differ.
Why can simulator returns differ from an ETF's 1Y, 3Y, or 5Y Total Return?
The Investment Simulator includes the timing of your initial investment and recurring contributions. An ETF's historical Total Return measures the performance of an investment over a defined historical period without modeling your recurring contribution schedule. Because the calculations answer different questions, the percentages may differ.
Where can I see an individual ETF's historical performance?
Open an ETF's detail page to review its Price History, available historical periods, Year-by-Year Breakdown, Price Return, Total Return, and Total Return CAGR.
What is the difference between Price Return and Total Return?
Price Return measures the change in ETF price. Total Return includes price changes plus the estimated effect of reinvesting dividends.
What does CAGR mean?
CAGR is the Compound Annual Growth Rate. It expresses a multi-year Total Return as an estimated average annual compounded rate.
What do 1Y, 3Y, 5Y, and MAX mean on Price History?
These buttons change the historical period displayed on an individual ETF's price chart. MAX shows the longest price history currently available in KIFOLIO.
What does the 200-Day MA show?
The 200-Day Moving Average shows the ETF's average closing price over approximately the last 200 trading days. KIFOLIO also shows how the current price compares with this average.
What are Top 10 Holdings?
Top 10 Holdings shows the available largest underlying holdings for an ETF. It is not a complete list of every security held by the ETF.
What does Sector Allocation show?
Sector Allocation shows the available sector composition for an individual ETF. ETF sector composition can change over time and may differ depending on data availability and classification methods.
What are Popular ETFs?
Popular ETFs are informational examples organized into categories such as Broad Market, Growth / Nasdaq, and Dividend / Income. They are not a live popularity ranking or an investment recommendation.
Are the simulator results guaranteed?
No. Simulation results are historical estimates based on available cached market and dividend data. They do not predict future performance and may differ from actual brokerage results. Taxes, fees, trading costs, and other factors may not be included.
Is My ETF Simulator investment advice?
No. My ETF Simulator is a planning and informational tool. It does not recommend an ETF, allocation, investment amount, or investment strategy and does not guarantee any investment result.
Options Tracker
What is Options Tracker?
Options Tracker helps you record and review option positions, premiums, expiration dates, strike prices, and other position details. It is a tracking and calculation tool and does not place trades with your brokerage.
Which option strategies can I track?
KIFOLIO supports Covered Calls, Cash-Secured Puts, Long Calls, Long Puts, and Custom / Multi-Leg strategies.
Custom / Multi-Leg includes strategies such as Vertical Call Spreads, Vertical Put Spreads, Iron Condors, Iron Butterflies, Straddles, Strangles, and custom option combinations.
What does KIFOLIO calculate for a Covered Call?
KIFOLIO uses the premium, strike price, contracts, and other position details you enter, along with the available underlying price, to calculate values such as total premium received, strike distance, price difference, and effective sale price.
What does KIFOLIO calculate for a Cash-Secured Put?
KIFOLIO uses the premium, strike price, contracts, and other position details you enter to calculate values such as total premium received, cash required, strike distance, price difference, and break-even price.
What are Cash Sources?
Cash Sources let you track funds that you consider available to support Cash-Secured Put positions.
You can add a cash amount or a supported security, such as a short-term Treasury ETF, and choose what percentage of its value should count as available cash.
How does Count as Cash % work?
Count as Cash % controls how much of a Cash Source is included in Available Cash for Options. For example, if a security has a market value of $1,000 and you set Count as Cash to 80%, KIFOLIO counts $800 as available cash.
What does Cash-Secured Put Summary show?
The summary compares your Available Cash for Options with the total cash required by your active Cash-Secured Put positions. It can show remaining available cash or a cash shortfall.
Are security prices in Cash Sources updated automatically?
When supported market data is available, KIFOLIO can use the security's available market price to calculate its market value and counted cash amount. Market information may be delayed and is not guaranteed to be real-time.
What is P/L Review?
P/L Review helps you review recorded options profit and loss by year, month, and strategy. It includes summaries of received and paid amounts based on your recorded option activity.
Does Options Tracker automatically determine whether my option was assigned or expired?
No. You should verify the final status of an option with your brokerage and update or close the position in KIFOLIO as appropriate.
Does Options Tracker place or manage option trades?
No. Options Tracker records and calculates information you enter or import. It does not place, modify, or close trades with your brokerage.
Crypto Tracker
What is Crypto Tracker?
Crypto Tracker lets you monitor cryptocurrency price trends, drawdowns, 200-day moving averages, and your own crypto holdings and performance. It is an informational and tracking tool and does not place cryptocurrency trades.
What is the difference between Tracker and My Portfolio?
Tracker focuses on market information such as current price, historical price trends, drawdowns, reference highs, and the 200-day moving average. My Portfolio lets you enter your own crypto holdings and review quantity, average cost, market value, allocation, and profit or loss.
Can I add cryptocurrencies to the Tracker?
Yes. Use the + button to add supported cryptocurrencies to your Tracker list.
What do 52W High and From High mean?
52W High is the highest tracked price during the most recent 52-week period. From High shows how far the current price is below that high as a percentage.
What is the 200-Day Moving Average?
The 200-day moving average is a long-term trend indicator based on historical prices. KIFOLIO also shows how far the current price is above or below the 200-day moving average.
What is the 3-Step Drop feature?
The 3-Step Drop feature compares the current price with a selected historical reference high and shows whether configured drawdown levels have been reached. You can review the levels using 1-year, 3-year, or 5-year reference periods.
Can I customize the Drop 1, Drop 2, and Drop 3 percentages?
Yes. Use Customize to change the percentage levels used for the three drawdown steps.
What do Reached and Not reached mean?
Reached means the tracked price has reached or moved below that configured drop level. Not reached means that level has not been reached based on the applicable price data.
Can I view cryptocurrency price history?
Yes. Crypto Tracker includes historical price charts for supported periods and can display the price trend together with the 200-day moving average and configured drop reference levels.
How does My Crypto Portfolio calculate my results?
Enter the quantity you hold and your average cost. KIFOLIO uses the available current market price to calculate market value, total cost, profit or loss, profit or loss percentage, and portfolio allocation.
Can I see the total performance of my crypto portfolio?
Yes. My Portfolio shows Total Value, Total Cost, Total P/L, and the overall P/L percentage for the crypto holdings you entered.
How is Portfolio Allocation calculated?
Portfolio Allocation shows each crypto holding's current market value as a percentage of the total current value of all crypto holdings in My Portfolio.
Can I edit, delete, or reorder my crypto holdings?
Yes. Holdings can be edited or deleted, and the available up and down controls can be used to change their display order.
Do I have to enter current cryptocurrency prices manually?
No. Supported current prices are provided through the KIFOLIO backend. Prices may be delayed and should not be treated as real-time trading quotes.
Does Crypto Tracker connect to my crypto exchange?
No. Crypto Tracker does not require a direct connection to your cryptocurrency exchange account and does not place or manage trades on an exchange.
Is Crypto Tracker investment advice?
No. Crypto Tracker and My Crypto Portfolio are provided for informational and tracking purposes only. Cryptocurrency involves significant risk, and the displayed information does not constitute investment advice or guarantee future results.
Investment Notes
What are Investment Notes?
Investment Notes let you save personal investment notes in KIFOLIO. You can optionally add a ticker, choose a category, pin important notes, and search your saved notes.
What categories can I use for Investment Notes?
Investment Notes support General, Buy/Sell, Options, Dividend, and Split categories. Adding a ticker is optional.
Can I show an Investment Note on the Home screen?
Yes. Turn on Show on Home, select a start date, and choose how long the note should appear. Available display periods are 1 day, 3 days, or 7 days.
When does a scheduled Investment Note appear on Home?
A scheduled note appears beginning on the selected start date and remains visible for the selected number of days. For example, a note starting August 28 with a 3-day duration appears on August 28, August 29, and August 30.
What happens when the Home display period ends?
The note automatically stops appearing on the Home screen, but the Investment Note itself is not deleted. It remains available in Investment Notes.
How many scheduled notes appear on the Home screen?
The Home screen displays up to three currently active scheduled notes. Tap View All to open Investment Notes and view your full note list.
Are Investment Notes linked to a portfolio account?
No. Investment Notes are shared across KIFOLIO and are not tied to one specific portfolio account.
Are Investment Notes included in Backup & Restore?
Yes. Investment Notes are included in Stocks & Options backup and Everything backup. They are not included in a Current Account-only backup or a Crypto-only backup.
Backup & Restore
What KIFOLIO data can I back up?
KIFOLIO lets you back up the current portfolio account, all Stocks & Options data, Crypto data, or everything together in one Full Backup.
What is Current Account Backup?
Current Account Backup saves only the currently selected portfolio account. It includes that account's Portfolio, received dividends, dividend goal, Options, and My ETF Simulator.
Are Watchlist and Market Drop included in Current Account Backup?
No. Watchlist and Market Drop settings are shared across accounts, so they are not included in an individual account backup.
What is Stocks & Options — All Accounts backup?
This backup includes all portfolio accounts, Dividend, Market Drop, Options, My ETF Simulator, Watchlist, Investment Notes, and related app settings.
What is included in Crypto Backup?
Crypto Backup includes crypto portfolio holdings, tracked coins, custom drop levels, the selected reference-high period, and locally stored Crypto settings.
What does Backup Everything do?
Backup Everything creates one Full Backup containing both Stocks & Options data and Crypto data.
Can I restore only one portfolio account?
Yes. Restore Into This Account lets you restore an account backup into the currently selected portfolio account.
Can I restore Stocks and Crypto separately?
Yes. Restore Stocks Backup and Restore Crypto Backup allow you to restore those data sets separately.
Can I restore everything at once?
Yes. Restore Full Backup restores the Stocks & Options and Crypto portions of a Full Backup together.
Are backup files uploaded to KIFOLIO servers?
No. KIFOLIO does not upload these backup files to the Ki Dev Studio server. The backup file remains under your control.
Can a backup contain personal portfolio information?
Yes. Backup files may contain personal portfolio information. Keep them in a safe location and share them only with people you trust.
What should I do before moving to a new phone?
Create a Full Backup on your old device, save the backup file in a safe location, and then use Restore Full Backup on the new device.
Can KIFOLIO recover a backup file that I lost?
No. KIFOLIO does not store your backup file on its server, so a lost backup file cannot be downloaded again from KIFOLIO.
Clear Data
What does Clear Current Account delete?
Clear Current Account deletes Portfolio, Dividend, Options, and My ETF Simulator data for only the currently selected account. Other portfolio accounts and common app-wide tools remain.
What does Clear All Accounts delete?
Clear All Accounts deletes investment data from every portfolio account. Watchlist, Market Drop, Crypto data, and Settings remain on the device.
What does Clear Crypto Data delete?
Clear Crypto Data deletes Crypto Portfolio and Crypto Tracker data only. Your stock portfolio accounts, dividends, options, Watchlist, Market Drop data, and Settings remain.
What does Clear All App Data delete?
Clear All App Data removes KIFOLIO user data stored by the app on this device, including portfolio accounts, Watchlist, Market Drop, Investment Notes, Crypto data, and Settings.
Can I undo Clear Data after I confirm it?
No. Cleared data cannot be restored unless you previously created a KIFOLIO backup that contains the deleted information.
Should I create a backup before clearing data?
Yes. If you may need the information again, create the appropriate backup from Backup & Restore before clearing the data.
Does Clear Data delete anything from my brokerage account?
No. Clear Data only removes information stored by KIFOLIO. It does not delete, modify, close, or otherwise change holdings or information in your brokerage account.
Settings
How do I change the name shown on the Home screen?
Go to Settings → Profile, enter your preferred Display Name, and tap Save Display Name. The saved name will appear on the Home screen.
Can I use KIFOLIO in Dark Mode?
Yes. Go to Settings → Dark Mode and turn the switch on or off at any time.
What are Options Expiration Alerts?
When enabled, KIFOLIO can show upcoming option expirations on the Home screen. You can turn these alerts on or off in Settings.
What are Market Drop Alerts?
When enabled, KIFOLIO can show Market Drop status and 52-week-high drop information on the Home screen. These indicators are informational only and are not buy or sell recommendations.
Where can I find help for using KIFOLIO?
Go to Settings → Help & Information → Help & FAQs. This opens the KIFOLIO Help & Guides website, where you can find help for Portfolio, Dividend, Market Drop, My ETF Simulator, Options Tracker, Crypto Tracker, Backup & Restore, and other features.
Is there an introduction video for KIFOLIO?
Yes. Select KIFOLIO Introduction under Help & Information to view the introductory video.
Where can I read the Privacy Policy and Terms of Use?
Both are available under Settings → Legal & Information. You can open the Privacy Policy and Terms of Use directly from the app.
Where does KIFOLIO get its market data?
Market data may be obtained from third-party data providers and processed or cached by KIFOLIO before being displayed. You can review current data-source information under Settings → Legal & Information → Market Data & Sources.
Are prices shown in KIFOLIO real-time?
No. Market prices may be delayed and can differ from prices displayed by your brokerage. Important financial information should be verified with your brokerage or another reliable source.
Does changing Settings modify my brokerage account?
No. KIFOLIO does not place trades, move money, or change settings in your brokerage account.
Where can I check the KIFOLIO app version?
Scroll to Settings → Legal & Information. The current app version is displayed near the bottom of the section.
Stock Splits
Does KIFOLIO automatically change my shares after a stock split?
No. KIFOLIO may detect and display stock-split review alerts, but not every stock split is guaranteed to be detected or displayed. Stock-split information may be delayed, incomplete, or unavailable.
KIFOLIO does not automatically change your share quantity or cost basis. Always verify stock splits and adjusted holdings with your brokerage, and update your KIFOLIO holdings if needed.